Performance Investigator
Designing an Analytics dashboard that reflects the performance to the publishers

The Challenge
-
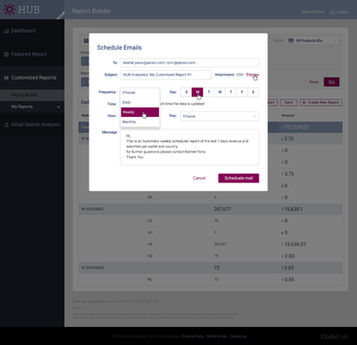
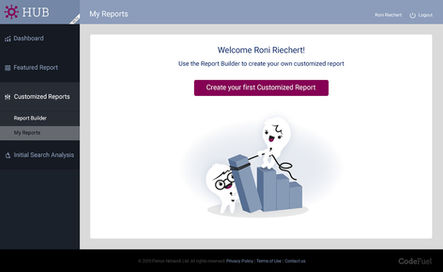
While offering a range of customizable reports is beneficial, ensuring that users can easily navigate and configure these options without feeling overwhelmed or confused presents a design challenge.
-
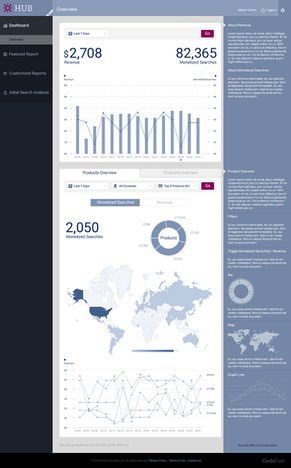
Presenting highly graphical views and performance data in a user-friendly manner requires careful design to ensure that users can easily interpret and derive insights from the presented information.
-
Ensuring seamless accessibility and usability across desktop and mobile devices poses a challenge, as the design must accommodate different screen sizes and interaction methods while maintaining consistency and usability.
My Role
Senior designer
About the Product
HUB is an in-house analytics tool for publishers (customers) that allow them to measure
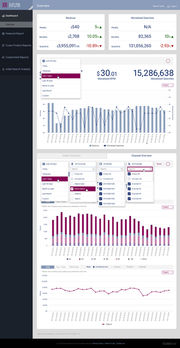
and monitor performance and make business decisions how to optimize their product performance and gain better revenue. It offers several dashboards, highly graphical views, allows to choose between predefined to customized reports through a very user-friendly interface. Everything is very simple and user center oriented.
Admin is a back-office interface designed to help Professional Services group to utilize the platform to serve the publishers (customers) needs. It is built of a main menu, each tab in the menu opens a whole set on options that represent a use-case, the user can configure items to meet specific business requirements.
Ideation
 |  |
|---|---|
 |  |
 |  |
└ Wireframes

└ Product Architecture
Desktop








Smartphone


Crafting the Details


User Testing Prototype

The Marketing Announcement


